Updated June 2026
Healthcare price transparency data is public pricing information that shows what hospitals, payers, and health plans charge or negotiate for medical services. It includes hospital standard charges, payer-specific negotiated rates, in-network rates, and out-of-network allowed amounts published under federal transparency rules.
But the strategic value is not just access to the files. The real opportunity is turning massive, messy machine-readable files into AI-powered market intelligence that healthcare organizations can actually use. Gigasheet helps teams analyze billions of public rates, benchmark payer and provider contracts, identify pricing outliers, and trace insights back to the original source data.
For providers, payers, self-funded employers, benefits consultants, and life sciences teams, healthcare price transparency data can support contract strategy, network design, reimbursement planning, market access, and cost management. This guide explains what the data contains, why it matters, how organizations use it, and how Gigasheet makes analysis practical at scale.
What Is Healthcare Price Transparency Data?
Healthcare price transparency data is structured pricing information that hospitals, payers, and health plans are required to publish publicly. It reveals the prices behind healthcare services, including standard charges, negotiated rates between payers and providers, and allowed amounts for out-of-network care.
The data typically appears in two forms. Machine-readable files, often JSON or CSV, contain detailed rate records for analysts, employers, researchers, and technology platforms. Consumer-friendly displays summarize selected shoppable services for patients.
The machine-readable files are the foundation for market intelligence because they expose the underlying rate data at scale. They can help answer questions such as:
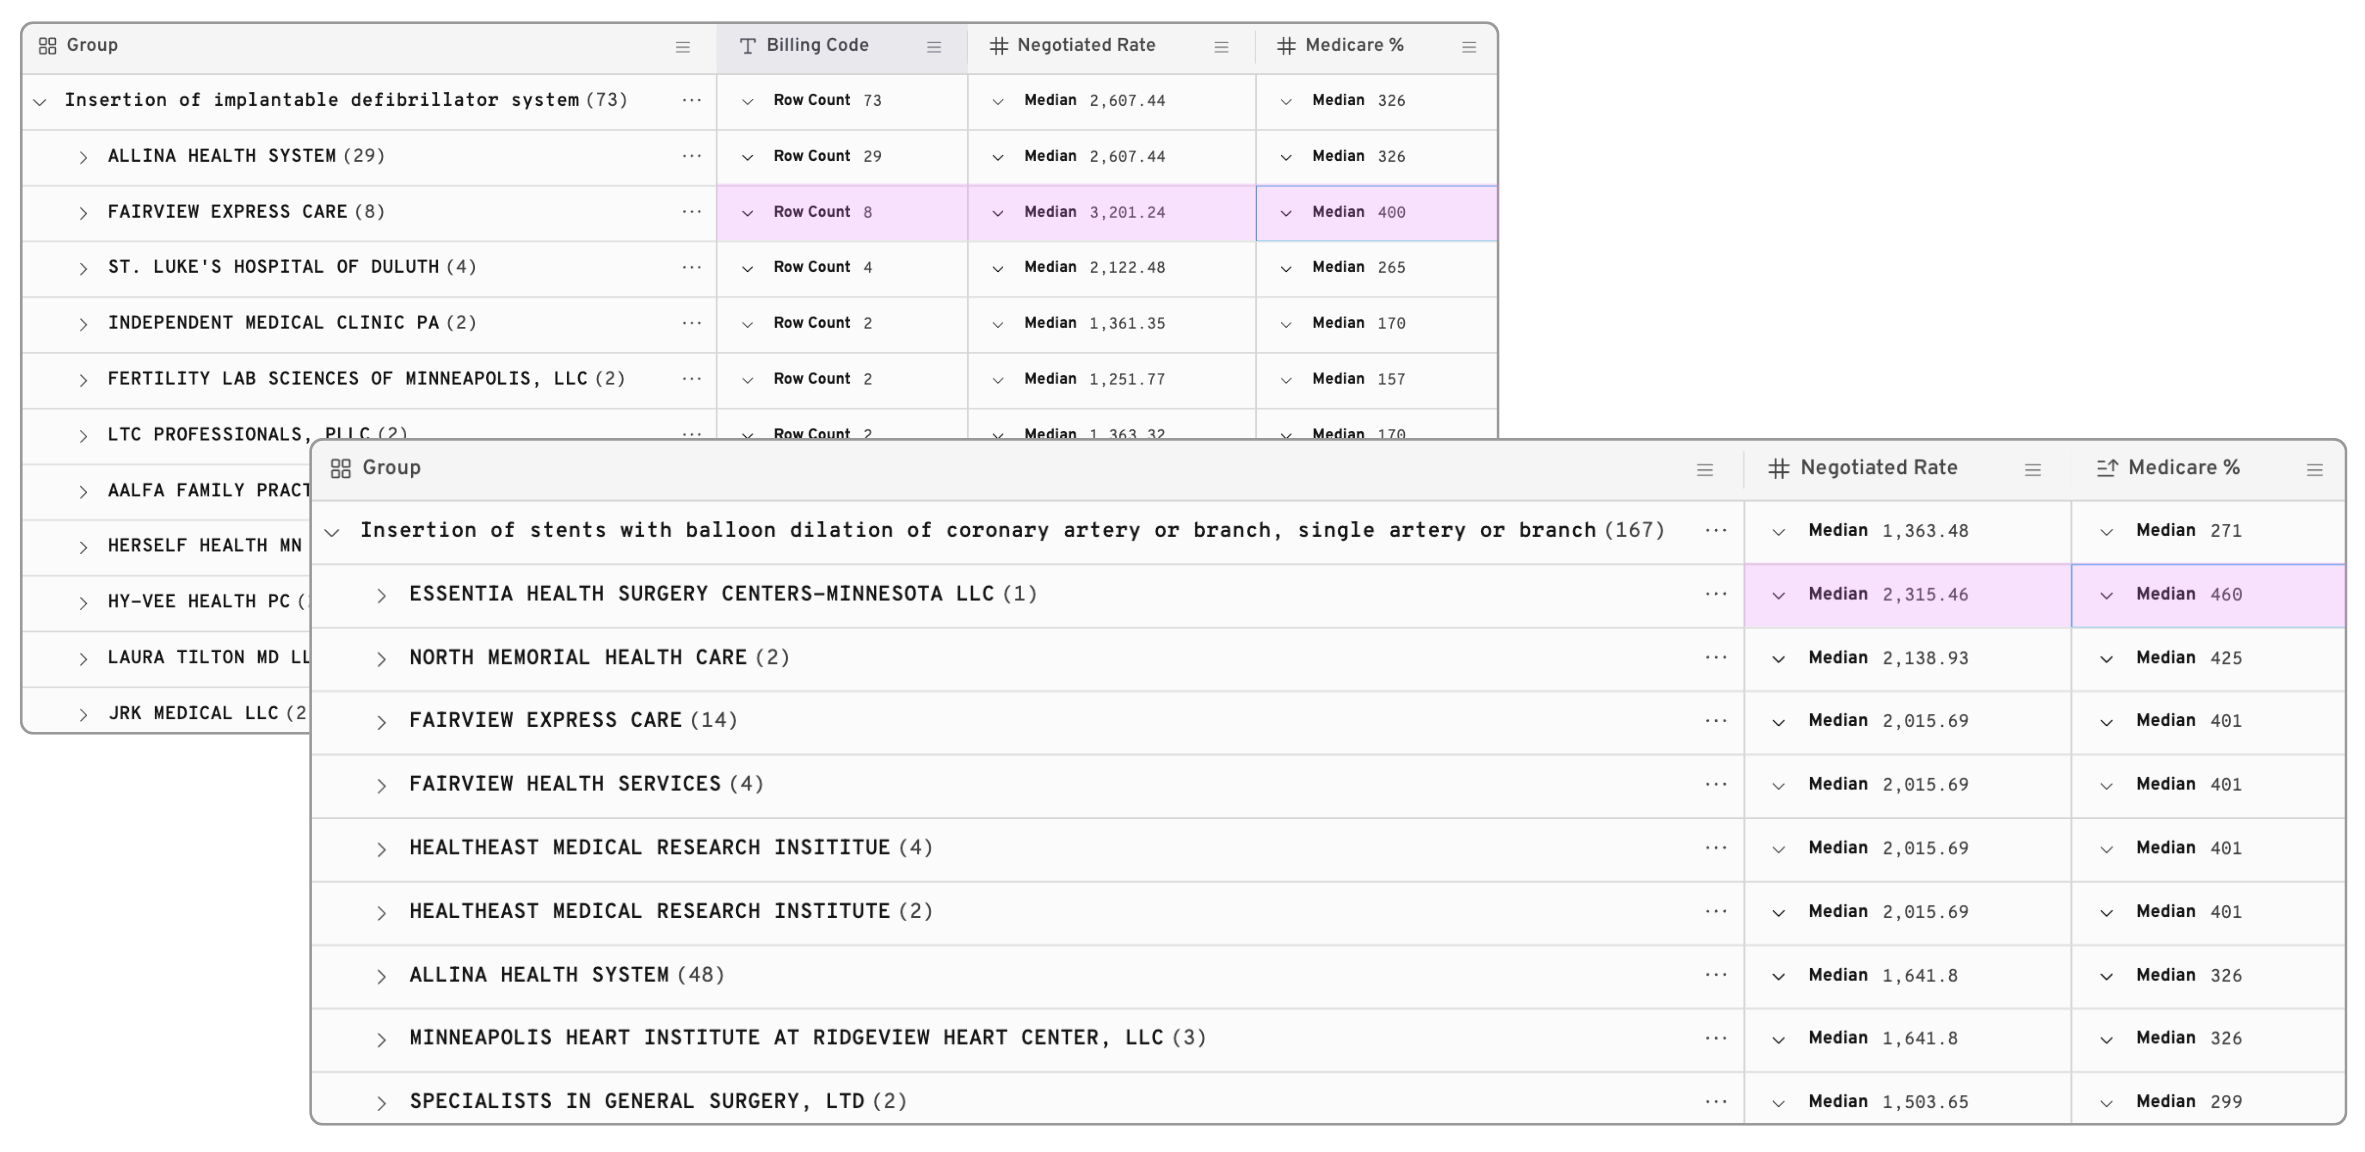
- What does a payer reimburse different providers for the same CPT code?
- How does a provider's commercial rate compare to peers in the same market?
- Which contracted rates appear above or below market?
- Where do network gaps or high-cost providers create avoidable spend?
- How does a self-funded employer's plan compare to broader commercial market rates?
- What real-world reimbursement rates can inform life sciences pricing, forecasting, or market access strategy?
Why Price Transparency Data Matters
Price transparency changes healthcare markets by making previously hidden pricing information visible. Organizations can compare rates, benchmark contracts, and test whether pricing aligns with market realities.
Provider Contract Strategy
Providers use negotiated rates data to understand how their reimbursement compares with peer organizations. If a provider is underpaid for high-volume services, transparency data can support stronger payer negotiations with specific market evidence.
Payer Network Design
Payers and plans use transparency data to benchmark competitor rates, identify savings opportunities, evaluate provider network economics, and support more competitive contracting. For managed care teams, this data can inform network design, tiering, and negotiation strategy. See Gigasheet's guide to price transparency data for managed care.
Self-Funded Employer Plan Strategy
Self-funded employers, brokers, consultants, and TPAs can use payer-published rates to evaluate whether a plan is getting competitive network economics. Gigasheet's self-insurance price transparency solution helps teams compare plans, benchmark high-cost services, and identify providers that may support better member navigation.
Life Sciences and MedTech Market Access
Life sciences and medical device teams can use price transparency data to understand real-world reimbursement for relevant codes, procedures, categories, and geographies. Gigasheet's MedTech and life sciences solution supports market access, reimbursement strategy, forecasting, and commercial planning with row-level visibility into payer-published data.
Key Federal Rules Driving Data Availability
Several federal mandates created the current healthcare price transparency landscape.
Hospital Price Transparency Rule
Effective January 2021, the Hospital Price Transparency rule requires hospitals to publish machine-readable files containing standard charges for items and services. These files include gross charges, discounted cash prices, payer-specific negotiated charges, and de-identified minimum and maximum negotiated charges.
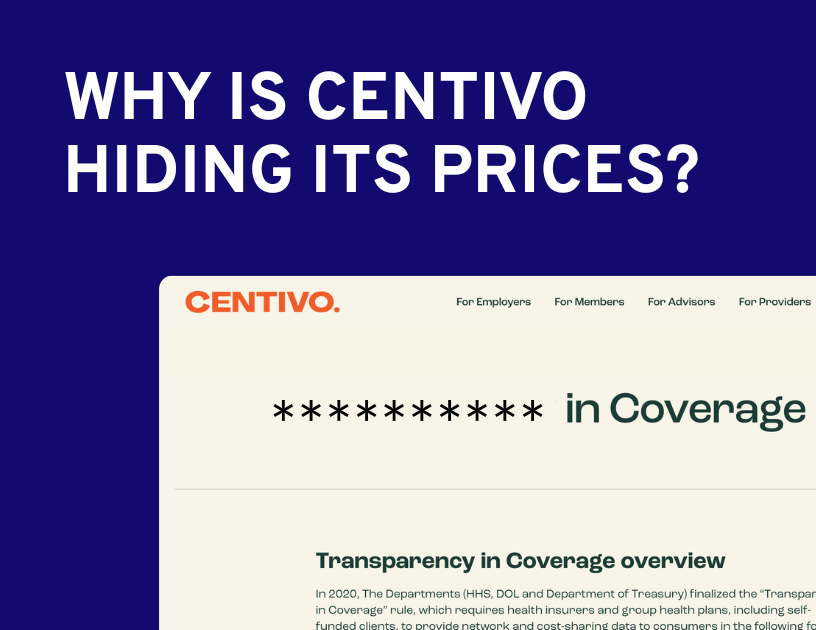
Transparency in Coverage Rule
The Transparency in Coverage rule requires health insurers and group health plans to disclose in-network negotiated rates and out-of-network allowed amounts. Payers publish machine-readable files that can span enormous volumes of rate records across providers, plans, geographies, and billing codes.
No Surprises Act
The No Surprises Act focuses primarily on surprise medical billing, but it complements the broader transparency movement by requiring advance cost estimates for many scheduled services.
What Data Elements Appear in Hospital and Payer Files?
Hospital and payer files contain different but related pricing information.
Standard Charges and Negotiated Rates
Standard charges are hospital list prices. Negotiated rates reflect amounts that payers have agreed to reimburse for specific services. A single procedure can have many negotiated rates depending on payer, plan, provider, place of service, and billing context.
In-Network and Out-of-Network Allowed Amounts
In-network rates apply to contracted providers. Out-of-network allowed amounts show what a payer allows for non-network services. Both can matter for benefit design, provider reimbursement, and market benchmarking.
Billing Codes and Service Descriptions
Transparency files rely on standardized coding systems, including CPT codes for procedures and services, DRG codes for inpatient stays, and HCPCS codes for supplies, equipment, and services not included in CPT.
Provider, Payer, Plan, and Location Fields
Useful analysis often depends on matching rate records to NPIs, TINs, organization names, specialties, plan information, facility locations, payer names, and service geographies. That matching is one reason raw files require enrichment before they can support confident decisions.
Why Raw Price Transparency Files Are Hard to Use
Federal transparency rules created access to pricing data, but access does not automatically create usable intelligence. The files are often too large, inconsistent, and noisy for traditional tools.
Common challenges include:
- Scale: Payer files can contain billions of rate records and reach hundreds of gigabytes.
- Schema variation: Hospitals and payers publish data in different structures, even when meeting the same regulatory requirements.
- Duplicate and overlapping records: The same service can appear across multiple plans, locations, providers, or rate types.
- Entity matching: Providers may appear under different NPIs, TINs, names, affiliations, or locations.
- Context gaps: Raw rates often need Medicare benchmarks, provider taxonomy, geography, utilization, or quality context to become meaningful.
- Implausible rates: Some records may be zombie rates that appear in the files but do not reflect realistic commercial reimbursement.
This is why organizations need more than a file viewer. They need a workflow that cleans, normalizes, enriches, benchmarks, and preserves source traceability.
How Gigasheet Turns Price Transparency Data Into Market Intelligence
Gigasheet's Price Transparency Data and Analytics platform is built to transform raw hospital and payer files into practical intelligence. Instead of stopping at file access, Gigasheet helps teams move from messy public data to answers they can use in strategy, contracting, and analysis.
Cleaned and Normalized Data
Gigasheet ingests, cleans, and structures hospital and payer machine-readable files so analysts can work with consistent fields across payers, providers, billing codes, and regions. This includes handling large JSON files, schema variation, duplicated records, and messy identifiers.
Enrichment and Benchmarking
Rate records become more useful when they are enriched with provider details, taxonomy data, geography, Medicare benchmarks, and market-level context. Gigasheet helps users compare rates across payers, providers, codes, plans, and regions without starting from raw files every time.
AI-Powered Analysis
AI helps surface outliers, summarize findings, detect patterns, and turn large rate tables into practical insights. Instead of manually reviewing millions of rows, analysts can ask focused questions, narrow to the relevant market or code set, and review the underlying data behind the answer.
Spreadsheet-Style Exploration at Massive Scale
Gigasheet gives business users a familiar spreadsheet-like interface for datasets that traditional spreadsheets cannot handle. Contracting teams, network managers, benefits consultants, commercial teams, and analysts can filter, group, sort, and inspect row-level data without waiting for custom engineering work.
Row-Level Traceability
Transparency analytics only matter if the source can be trusted. Gigasheet preserves row-level detail so users can trace insights back to the original machine-readable files. That matters when benchmarks are used in negotiations, executive decisions, or client-facing analysis.
Common Use Cases for Healthcare Price Transparency Data
Healthcare price transparency data is used by many teams, but the strongest use cases usually share one pattern: they turn rate visibility into a decision about contracts, networks, markets, or strategy.
- Providers: Benchmark payer contracts, identify under-market rates, prepare renewals, and prioritize high-impact service lines.
- Payers and plans: Evaluate network competitiveness, benchmark reimbursement, identify savings opportunities, and support employer-facing discussions.
- Self-funded employers and benefits partners: Compare plan rates, validate network economics, identify high-cost services, and support member steerage strategies.
- Life sciences and MedTech teams: Understand reimbursement patterns, validate pricing assumptions, compare procedure economics, and support market access strategy.
- Consultants and advisors: Convert public data into defensible benchmarks, client recommendations, and recurring market intelligence workflows.
Future Trends in Healthcare Price Transparency
The transparency landscape continues to evolve as regulators, technology providers, and healthcare organizations adapt to the availability of public rates data.
More Enforcement and Better Compliance
Regulators continue to push for more complete and usable data. As enforcement increases, the quality and completeness of public files should keep improving.
Greater Standardization
More consistent schemas and reporting practices would reduce cleanup burden and make cross-market analysis easier. Until then, normalization remains a core part of the analytics workflow.
AI-Native Market Intelligence
The next stage of price transparency is not static dashboards. It is AI-assisted analysis that can summarize findings, surface anomalies, answer business questions, and preserve the row-level evidence behind every result.
Turn price transparency data into market intelligence
Explore how Gigasheet helps healthcare teams analyze billions of public rates, benchmark contracts, and trace every insight back to the source data.
Book a DemoFAQs About Healthcare Price Transparency Data
What is healthcare price transparency data?
Healthcare price transparency data is publicly disclosed pricing information from hospitals, payers, and health plans. It includes hospital standard charges, payer-specific negotiated charges, in-network negotiated rates, and out-of-network allowed amounts.
What data is included in hospital price transparency files?
Hospital files usually include gross charges, discounted cash prices, payer-specific negotiated charges, and de-identified minimum and maximum negotiated charges for hospital items and services.
What data is included in payer Transparency in Coverage files?
Payer Transparency in Coverage files include in-network negotiated rates and out-of-network allowed amounts for covered items and services. These files are often extremely large and can include rates across many providers, plans, codes, and geographies.
Why are healthcare price transparency files hard to analyze?
The files are massive, inconsistent, and difficult to normalize. Useful analysis often requires parsing large JSON files, mapping provider identities, removing duplicates, filtering implausible rates, enriching records, and benchmarking rates against Medicare or market references.
How do organizations use healthcare price transparency data?
Organizations use price transparency data for provider contract negotiations, payer network design, self-funded plan benchmarking, benefits consulting, market access strategy, reimbursement analysis, and healthcare market intelligence.
How can AI help analyze healthcare price transparency data?
AI can help summarize large datasets, detect outlier rates, identify patterns, answer natural-language questions, and accelerate analysis. The best AI workflows also preserve row-level traceability so users can verify the source behind each insight.
Who uses price transparency analytics?
Price transparency analytics are used by providers, payers, health plans, self-funded employers, brokers, TPAs, benefits consultants, life sciences companies, MedTech teams, and healthcare strategy groups.
What makes Gigasheet different from static rate databases?
Gigasheet combines cleaned and enriched price transparency data, AI-powered analysis, spreadsheet-style exploration, and row-level visibility. Users can move from high-level benchmarks to the original source records instead of relying only on static dashboards or canned reports.
The intelligence layer for price transparency.