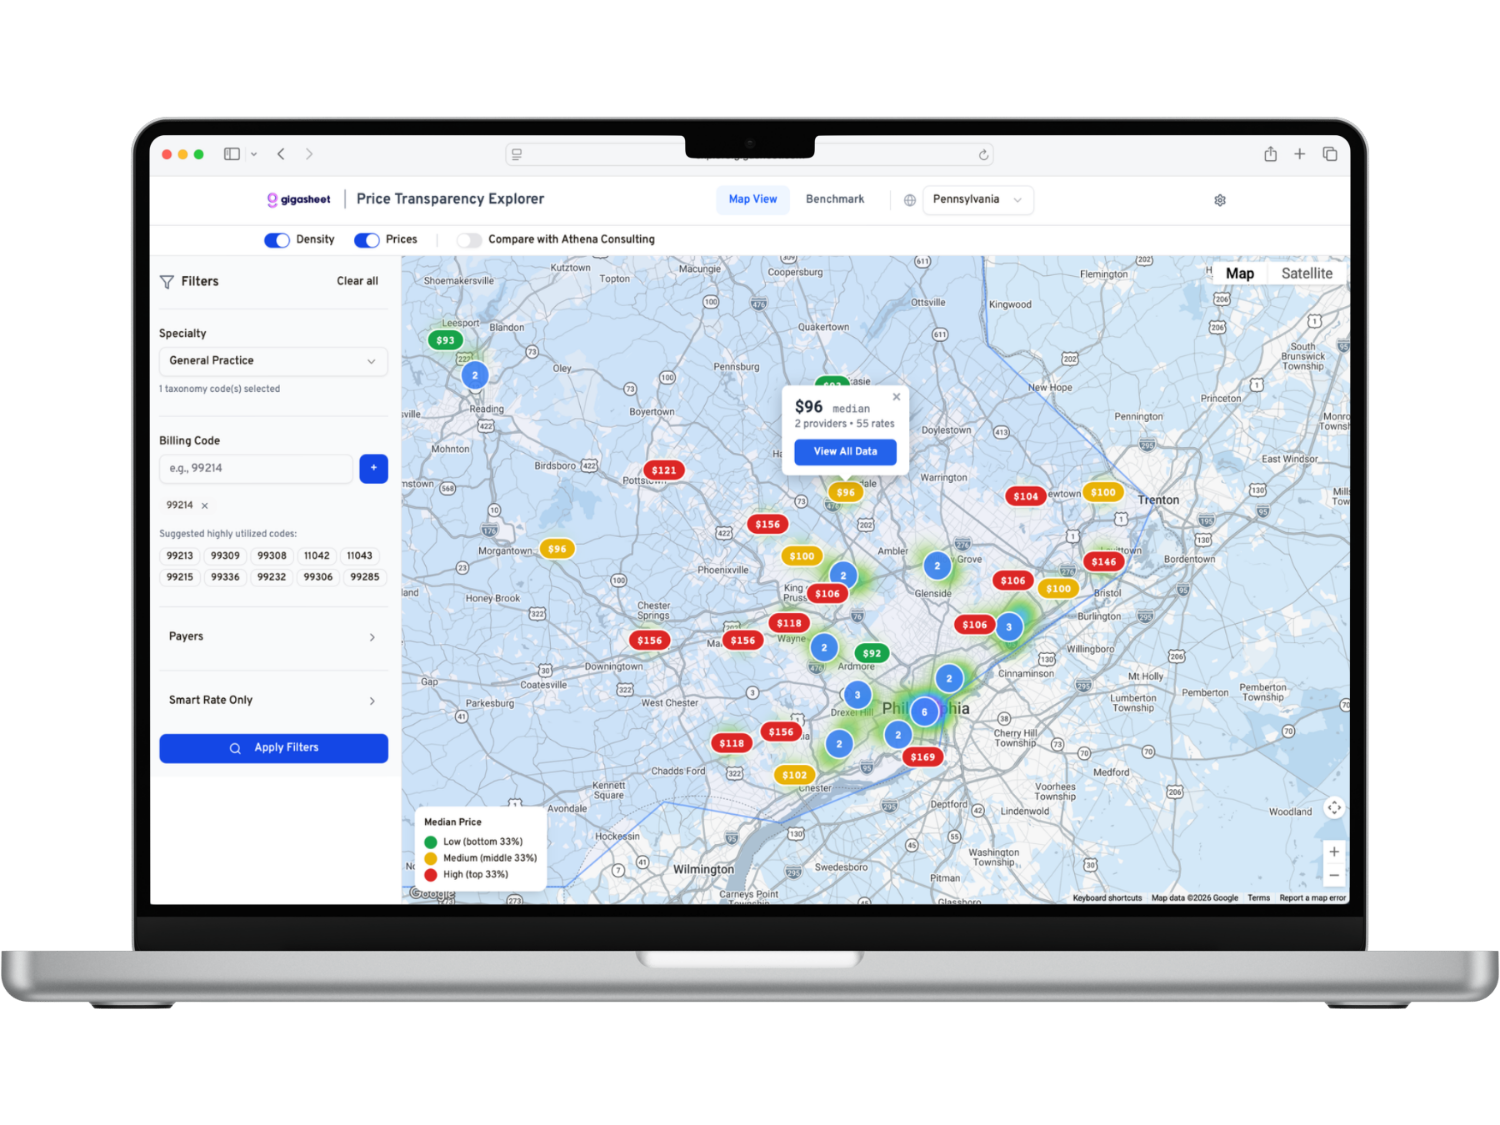

Price transparency + provider intelligence

Healthcare Market Intelligence

Benchmark negotiated rates, evaluate providers, and compare networks with nationwide healthcare data.

150B+
Valid payer rates
3M+
Providers scored
5,500+
Hospitals
Median negotiated rate by market
Illustrative market view
Trusted by teams at
FL Healthcare Alliance
Cognizant
Uber Health
Nationwide Insurance
Cambrex Life Science
Market Intelligence Graph

How Gigasheet maps the healthcare market

Gigasheet’s AI-driven Market Intelligence Graph connects data from thousands of sources, including hospital and payer price transparency files, IRS filings, provider directories, and the open web. Trace how clinicians, practices, and health systems are affiliated. See a provider’s professional background and reputation alongside the networks they participate in and the rates negotiated for their services.

Explore the Market Intelligence Graph →
Practice
Contracting entity
3 affiliated clinicians · 2 plans shown
Affiliated
Affiliated clinicians
IM
Profile
Background
Reputation
4.8 of 5 across public patient reviews
Source: open web
Networks
FM
Family medicine physician
Individual clinician
›
NP
Nurse practitioner
Individual clinician
›
In network
Plans and rates
Plan A
In network
· negotiated rate
Plan B
In network
· negotiated rate
Same procedure, two negotiated rates.
Illustrative example · · · · files
✓

Comparable. Placeholder and never-billed rates are excluded, and the reason is recorded.

✓

Nationwide. Rates from national and regional payers and more than 5,500 hospitals.

✓

Traceable. Trace negotiated rates to payer and hospital files. See the sources behind provider backgrounds and reputation.

✓

Supported. Gigasheet analysts help you frame the question and interpret the answer.

Benchmark any rate

Who belongs in the benchmark?

Compare any negotiated rate with the real distribution in its market: percentiles, medians, and the dollar difference, with every figure traced back to the file it came from.

The selected rate is the market median.

Market median across comparable rates from providers and plans

Low
25th
Median
75th
High
Difference from market median
per procedure the market median across comparable rates
Illustrative example
The platform

Explore the market. Build with the data.

Analyze rates, providers, and networks in Gigasheet, bring national data into your warehouse, or add benchmarks to your application through the API.

Use cases

How healthcare teams use Gigasheet.

What would a network change mean for an employer?

Apply competing networks' negotiated rates to the same utilization mix to model the difference. Use the results in benefits research, a plan comparison, or an employer-facing tool.

  • ✓
    Hold utilization constant and vary the network
  • ✓
    Compare carrier networks against the local market
  • ✓
    Deliver the analysis in research, a review, or your own product
Same utilization, different networks
index = 100
Current
112
Network B
96
Network C
104
Modeled on one utilization mix · negotiated rates, not paid claims
Sample view

Which claims warrant a closer look?

Compare high-cost claims with local negotiated rates for the same service. Give payment integrity and fraud, waste, and abuse teams the comparison set and its sources so they can prioritize claims for review.

  • ✓
    Benchmark each high-cost claim against local rates for the same service
  • ✓
    Give reviewers the comparison set and the files behind it
  • ✓
    Put the benchmark inside your claim review tool through the API
Claim vs. local negotiated rates, same service
2.9x median
This claim
$3,240
Local 75th
$1,680
Local median
$1,120
Comparison set: 38 negotiated rates · 12 providers · sources linked
Sample view

Where do we have a case for a rate change?

Compare contracted rates with local peers by payer and procedure. Bring specific comparisons into the next payer discussion.

  • ✓
    Benchmark your rates by payer, procedure, and location
  • ✓
    Identify the codes where you sit furthest from the median
  • ✓
    Cite traceable, row-level evidence for each comparison
Below Market
4
40%
At Market
5
50%
Above Market
1
10%
Difference from market median, 4 codes below
$311,838
At stated annual volume · negotiated rates, not paid claims
Sample view

Which providers could fill a network gap?

Find providers by specialty and location, then evaluate their professional backgrounds, network participation, and negotiated rates.

  • ✓
    Search 3M+ providers by specialty and location
  • ✓
    Review background, credentials, and network participation
  • ✓
    See where each provider's rates sit against the local market
Provider Rate Scores
vs. market
Orthopedic group
Below Market
Imaging center
Below Market
Multi-specialty clinic
At Market
Ambulatory surgery center
Above Market
Specialty, background, and network participation on every record
Sample view

What do comparable rates show in this market?

Research published rates for the service and geography at issue, document the comparison criteria, and trace the figures to their sources.

  • ✓
    Define the service, geography, and billing class under review
  • ✓
    Record the criteria behind every comparison set
  • ✓
    Trace each figure to the published file it came from
Comparable rates by geography
low · median · high
Philadelphia
Suburbs
Statewide
Criteria: same code, same billing class · 4 source files cited
Sample view
Customer story
I would have never found this provider if it weren't for Gigasheet. That was the first one where I was like, this is actually going to make an impact in my day-to-day.
Ben Yurk
Network Development Executive, HOMELINK®, a division of VGM Group
Read the story →
“Gigasheet's price transparency data has transformed how we access and understand negotiated rates. It's been invaluable for managing reimbursements and staying competitive.”
Dr. Timothy Mountcastle, MD
Chief of Plastic Surgery Emeritus, INOVA Loudoun Hospital
Healthcare price intelligence

From one practice to an entire network.

Start with a provider roster, a set of claims, or a network you’re evaluating. Connect it to nationwide provider intelligence and negotiated rates in Gigasheet, through our API, or in your warehouse.

  • ✓
    National coverage
  • ✓
    Scored and benchmarked rates
  • ✓
    Expert support
Market range ·
Illustrative example
Low
Median
High

Rates for the same service can differ several times over within one market. Start with the rates that apply to yours.

By using this website, you agree to the storing of cookies on your device to enhance site navigation, analyze site usage, and assist in our marketing efforts. View our Privacy Policy for more information.