When analyzing self-funded employer claims, benefits, or provider networks, the key question is often: Are we overpaying for drugs? While it's not always possible to answer definitively, price transparency regulations and the right tools now offer a rare window into this otherwise opaque space.
This blog walks through a step-by-step methodology using Gigasheet to analyze negotiated drug rates between payers and providers. With the right filters and datasets, you can turn massive machine-readable files into actionable insights on prescription drug costs, helping contain spend, steer care, and improve contracting strategies.
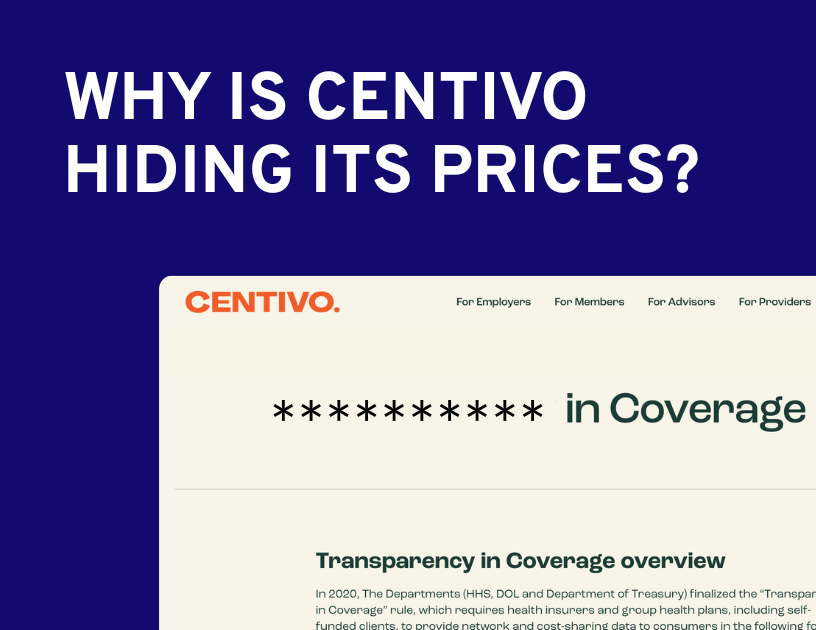
Why Drug Pricing Insights Matter
Consultants, benefits managers, and employers all play critical roles in managing healthcare costs. Historically, a lack of visibility into actual reimbursement rates has been a major barrier to optimizing drug spend. Without transparency, it's hard to:
- Identify pricing outliers for high-cost drugs
- Evaluate the efficiency of payer-provider contracts
- Benchmark against Medicare reimbursement levels
- Steer utilization toward lower-cost providers
Now that insurers are required to publish negotiated rates, it's finally possible to access this data. Gigasheet helps make the process fast and manageable.
Step 1: Start with Machine-Readable Files (MRFs)
Under the Transparency in Coverage (TiC) rule, insurers must publish machine-readable files (MRFs) each month listing their in-network negotiated rates with every provider. These files include pricing for procedures, office visits, and—increasingly important—prescription drugs administered in clinical settings.
The challenges:
- Files are massive, often 50 to 200 GB+
- Data is stored in deeply nested JSON structures
- Each insurer publishes multiple files across different endpoints
Gigasheet's platform for Price Transparency automatically flattens and processes these files, turning them into a spreadsheet-like interface. We also enrich each record with the National Provider Identifier (NPI) registry, adding provider names, types, and locations. (And we already have a catalog of terabytes of MRFs that are preprocessed and ready for analysis!) This transformation eliminates the need for custom code or infrastructure and makes the data immediately explorable in an intuitive interface.
Step 2: Add a Baseline with CMS ASP Drug Prices
To evaluate whether a negotiated commercial rate is high or low, we need a benchmark. Medicare provides the most widely accepted baseline.
The CMS Average Sales Price (ASP) file lists pricing for **Medicare Part B drugs, **typically infusions and injectable therapies. Updated quarterly, it includes 942 drugs along with:
- HCPCS codes
- Billing units
- Payment allowance limits (i.e., what Medicare reimburses)
You can access the CMS ASP file directly or explore the data in Gigasheet.
Joining this file into our workflow gives us the context needed to compare negotiated rates against a public standard.
Step 3: Filter MRFs to Relevant Drug Entries
Once the MRF is loaded, use Gigasheet’s Filter by Sheet feature to isolate drug-specific rows. We prefilter using the 942 HCPCS codes from the CMS ASP file to eliminate unrelated procedures and services.
This narrows the scope and allows you to:
- Analyze drug pricing at the NPI level
- Group and sort prices by drug or unit cost
- Explore variations by provider type or market
Step 4: Focus on Providers or Facilities of Interest
From there, you can filter the dataset further by specific providers, facility types, or regional markets. For example:
- Focus on infusion centers in a specific metro
- Filter by hospitals within a single health system
- Compare outpatient sites of care across different carriers
This lets you zero in on the actual prices relevant to your population.
What You Get: Clear Visibility into Drug Price Variation
The end result is a transparent view into how different providers are reimbursed for the same drugs. Each row shows:
- The payer
- The drug (HCPCS code)
- The provider or facility (NPI)
- The negotiated rate
- And optionally a comparison to Medicare ASP
This allows you to:
- Identify high-cost providers
- Evaluate variation within a market
- Compare rates across sites of care
- Highlight drugs with high commercial markups
Real-World Use Cases
For Consultants:
- Steer clients toward lower-cost drug delivery settings
- Support carrier contract negotiations with hard data
- Benchmark markets for regional strategy
For Self-Insured Employers:
- Audit your carrier’s pricing
- Create employee education tools about cost-effective care
- Align steering programs with actual negotiated rates
For Life Sciences and Market Access:
- Monitor payer reimbursement trends
- Understand competitive pricing environments by region
- Assess site-of-care economics for therapy launches
How Gigasheet Makes It Possible
This analysis would typically require:
- Heavy IT infrastructure for parsing enormous JSON files
- Writing scripts to extract and match data
- Joining drug code lists and NPI registries manually
- Custom infrastructure in data warehouses for large-scale filtering
Gigasheet removes all of that complexity. With a simple UI, you can:
- Load and explore multi-GB MRFs instantly
- Filter by HCPCS code or provider NPI
- Join Medicare pricing and NPI data with no code
- Share analysis or export results as needed
Drug cost variation is no longer hidden. With price transparency data and the right tools, consultants, benefits teams, and employers can finally get visibility into what they’re paying, and why. Gigasheet turns this data into insight, without needing to build or maintain a data pipeline.
Have a use case in mind or want to run this analysis with your own MRFs? Reach out to our team.
The intelligence layer for price transparency.