
Healthcare
The Largest Medicaid Dataset Ever Released Is Now Publicly Searchable on Gigasheet

What 227 Million Claims Rows Reveal About Personal Care Spending, State Rate Disparities, and the Providers Driving Medicaid's Fastest-Growing Cost Category
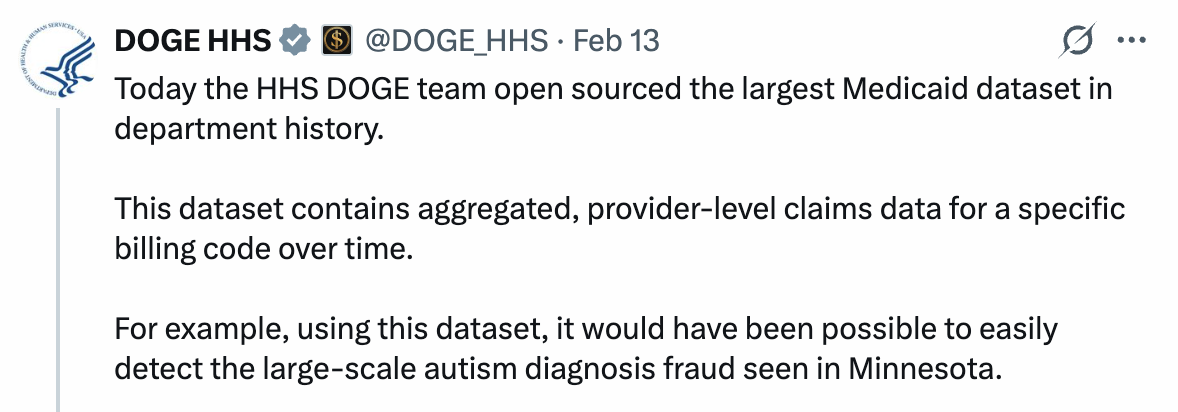
In February 2026, the HHS DOGE team released the largest Medicaid dataset in department history: aggregated, provider-level claims data covering outpatient and professional services billed with valid HCPCS codes from January 2018 through December 2024.
The raw CMS file is useful but limited. Each row identifies providers only by NPI number, with no names, addresses, or specialty classifications. Gigasheet enriched the full 227-million-row dataset with provider details from the National Plan and Provider Enumeration System (NPPES), including billing organization names, service locations, taxonomy codes, and entity types. We also added derived metrics including the amount paid per claim, claims per beneficiary, and paid per beneficiary.
The result is a fully searchable, filterable, and analyzable dataset that anyone can explore directly in Gigasheet.
Here is what we found when we analyzed it.
Personal Care Services (HCPCS T1019) Dominate Medicaid Outpatient Spending
HCPCS code T1019, which covers non-skilled personal care services provided in a home or community setting, is the single largest spending category in this dataset across every year from 2018 through 2024. T1019 funds home attendants, personal care aides, and consumer-directed care programs that allow Medicaid beneficiaries to receive assistance with daily living activities outside of institutional settings.
The scale is striking. Tempus Unlimited, Inc., a Massachusetts-based nonprofit that administers the state's Personal Care Attendant (PCA) program, billed $34.1 million in T1019 claims in January 2018. By July 2024, that figure had reached $118.9 million per month, a 3.5x increase from a single organization billing a single HCPCS code.
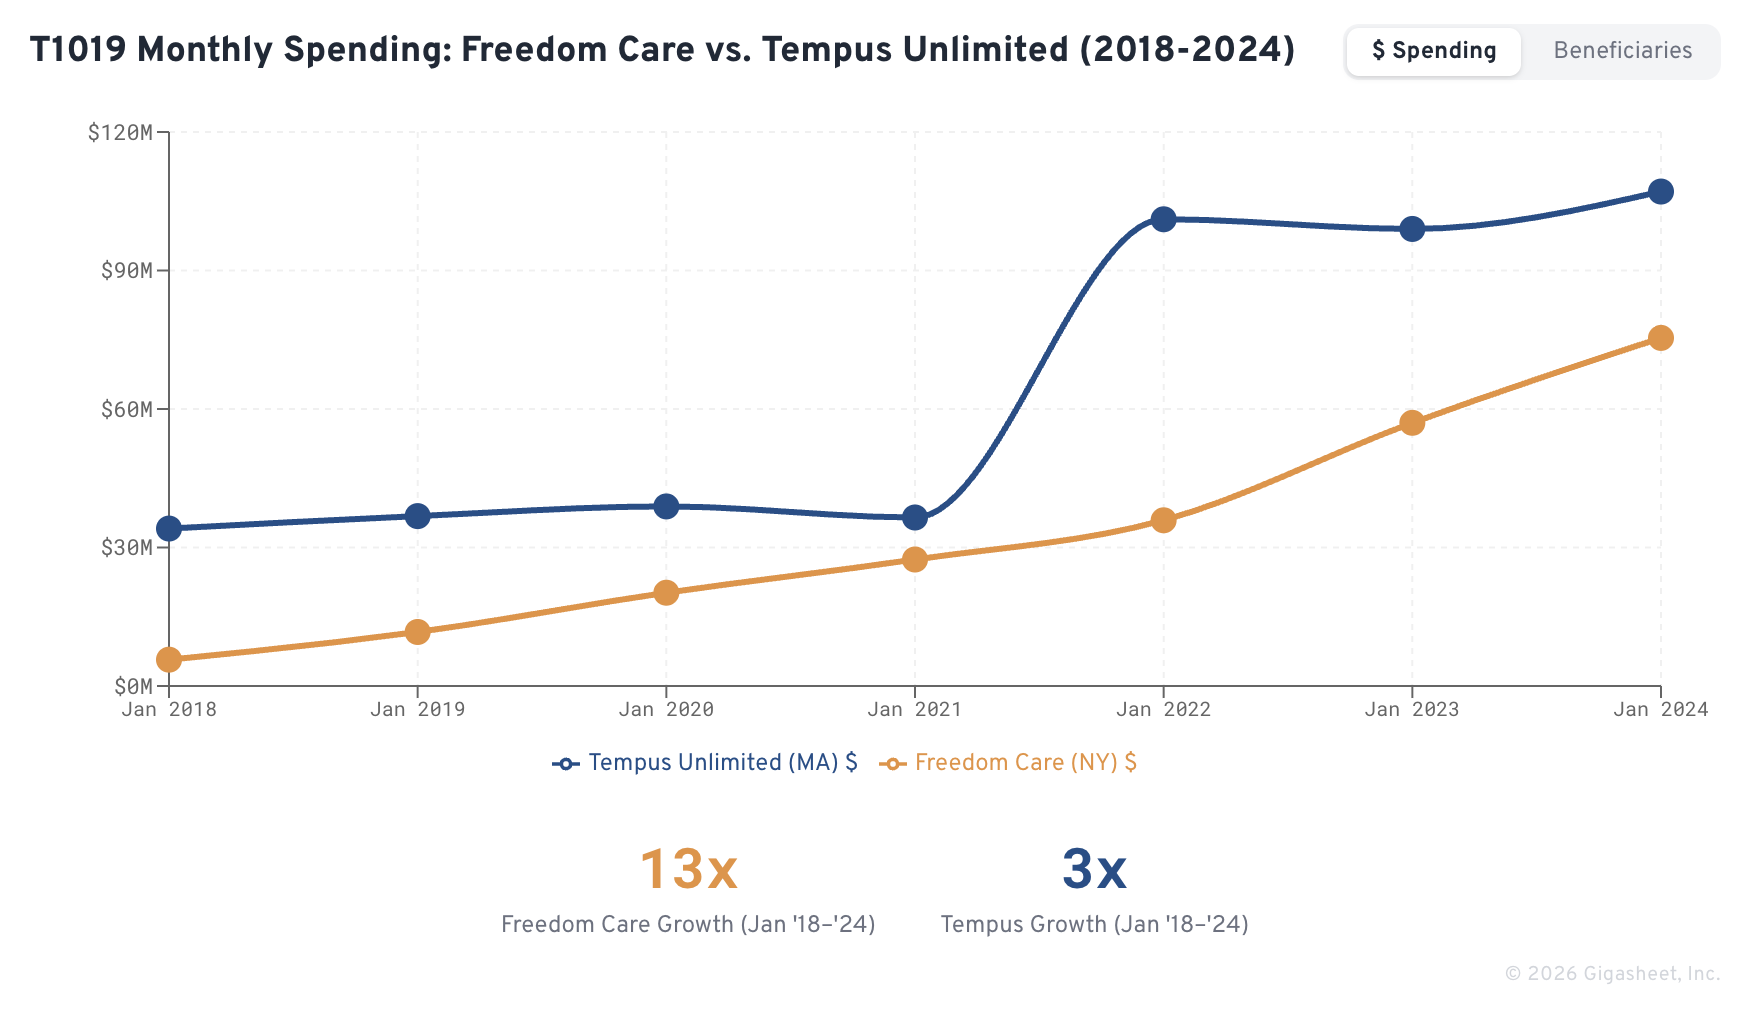
The growth is not primarily driven by rate increases. Tempus Unlimited's per-claim reimbursement rose from $88.29 in January 2018 to $98.60 in July 2024, an increase of just 12% over 6.5 years. The far larger driver is utilization expansion: the number of unique beneficiaries served grew from 17,200 to 39,765, more than doubling the population receiving services. Claims volume tripled from 386,645 to 1,205,701 per month.
This pattern, where modest rate increases combine with rapid utilization growth to drive exponential total spending, is the defining dynamic of Medicaid personal care across the dataset.
Freedom Care LLC: 14.5x Growth in 6.5 Years
The most dramatic growth trajectory in the dataset belongs to Freedom Care LLC, a New York-based fiscal intermediary that administers the state's Consumer Directed Personal Assistance Program (CDPAP). CDPAP allows Medicaid beneficiaries to hire, train, and direct their own personal care aides, including family members.
In January 2018, Freedom Care billed $5.7 million in T1019 claims, serving 2,140 beneficiaries with 42,732 claims. By July 2024, those numbers had grown to $82.9 million per month, 28,053 beneficiaries, and 546,207 monthly claims.
The data reveals that Freedom Care's growth was driven almost entirely by beneficiary enrollment expansion, not rate changes. The per-claim rate stayed roughly in the $127–$152 range throughout, and each beneficiary averaged roughly 19 claims per month (consistent with approximately one claim per weekday). What changed was the number of people enrolled: from 2,140 to 28,053.
This trajectory tracks the broader expansion of New York's CDPAP program, which has been the subject of significant legislative scrutiny and reform efforts. In 2023, New York enacted provisions to consolidate fiscal intermediaries and tighten eligibility requirements amid concerns about program costs exceeding $9 billion annually statewide.
New York Pays $152–$210 Per T1019 Claim. Massachusetts Pays $99. Same Service.
One of the most actionable findings in the dataset is the wide gap in reimbursement rates for the same HCPCS code across states. T1019, personal care services, is billed by providers in both New York and Massachusetts at high volume. The per-claim rates are starkly different.
Key finding: New York reimburses 54-113% more than Massachusetts for the same T1019 personal care service. The highest NY rate ($210/claim) is more than double the MA rate.

New York's T1019 rates range from $152 to $210 per claim across the top providers in July 2024. Massachusetts's largest T1019 provider, Tempus Unlimited, is reimbursed at $98.60. This is not a difference in service scope: both states use T1019 for non-skilled personal care in home settings. The difference is entirely in how each state's Medicaid program sets its fee schedule.
Extreme Per-Claim Rates: $17,575 for a Single Billing Code
Filtering the dataset for claims where the paid-per-claim amount exceeds $10,000 surfaces 10,086 rows out of 227 million, a fraction of a percent. The top result is consistent and instructive.
The Massachusetts Department of Developmental Services (DDS) bills HCPCS code T2016, which covers individualized service planning and case management for individuals with developmental disabilities. DDS serves approximately 1,000–1,200 beneficiaries per month through this code, generating $12–$20 million in monthly billings. The per-claim rate has grown from $12,398 in January 2019 to $17,575 in January 2022, a 42% increase in three years.
MA DDS, T2016
$12,398 → $17,575/claim
42% rate increase, 2019–2022
Each beneficiary averages 1.14–1.22 claims per month, meaning the effective per-beneficiary monthly cost is approximately $20,000. These are among the highest per-person Medicaid expenditures anywhere in the dataset. The T2016 code is used for comprehensive care coordination, and the rates reflect the intensive case management required for individuals with complex developmental disability needs.
An Anomaly Worth Investigating: MAINS'L FLORIDA and H0044
MAINS'L FLORIDA, INC., classified as a Home Health Agency and physically located in Brooklyn Park, Minnesota, bills exclusively under HCPCS code H0044, which typically covers behavioral health day treatment or intensive residential services. The company has been present in the dataset since January 2018 and has grown steadily, with per-claim rates rising 72% over seven years.
The claims-per-beneficiary ratio of exactly 1.0 is notable. Each beneficiary receives precisely one claim per month at a rate that now exceeds $4,000. For context, H0044 is often used as a per-diem code for residential treatment, where you would typically expect 20–30 claims per beneficiary per month (one per day of service). A ratio of 1.0 suggests that the billing represents either a monthly bundled rate or a non-standard application of the code. The company name references Florida while the physical address is in Minnesota.
This is not an accusation. It is a demonstration of what becomes visible when 227 million rows of claims data are enriched with provider details and made searchable. Tracking a single provider's rate trajectory across seven years, identifying unusual billing patterns, and quantifying growth trends at the NPI level is precisely the use case that healthcare price transparency data was designed to enable.
COVID-19's Measurable Impact on Claims Volume
The dataset spans the entire pandemic period, and the signal is clear. In a typical pre-pandemic month like January 2019, the dataset contains 2.46 million unique provider-procedure-month records. By April 2020, that number dropped to 1.33 million, a 46% decline in billing activity.
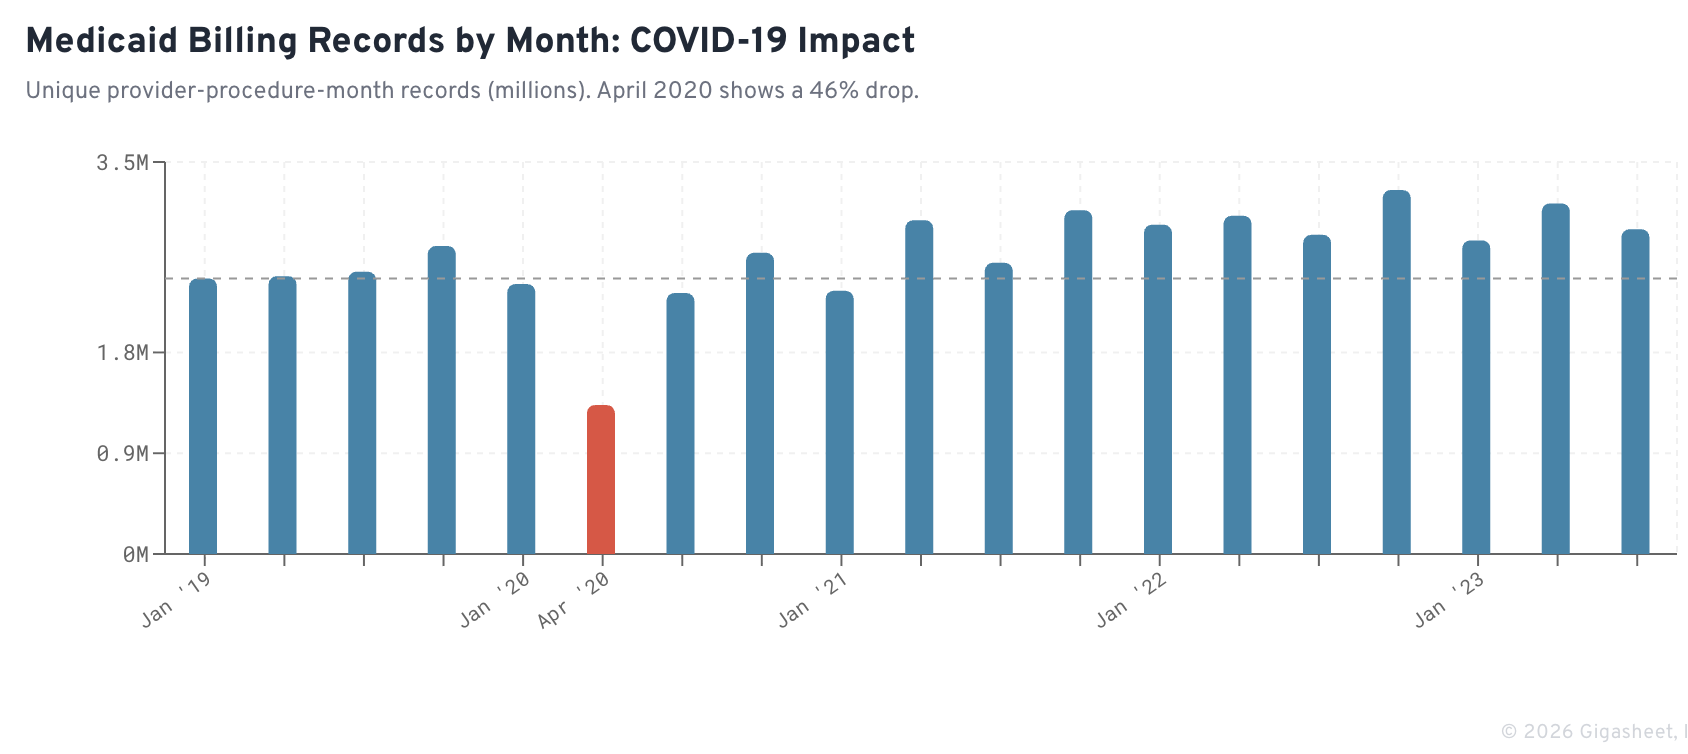
The decline was not uniform. Clinic-based outpatient services saw sharp volume drops as in-person care was deferred. But home-based personal care providers like Tempus Unlimited and Freedom Care maintained or grew their spending levels through the pandemic, reflecting the essential nature of in-home attendant services for Medicaid's most vulnerable populations.
By January 2022, records had rebounded to 2.94 million, exceeding pre-pandemic levels and reflecting both the return of deferred care and continued expansion of community-based service programs.
What This Dataset Reveals About Medicaid Spending
Combining CMS Medicaid claims data with provider enrichment from the National Plan and Provider Enumeration System (NPPES) creates a dataset that has not previously existed in the public domain: a provider-level view of where Medicaid dollars flow by procedure, provider, month, and state.
The dataset covers 2018 through 2024 and makes it possible to analyze reimbursement, utilization, and provider participation patterns across seven years of Medicaid activity.
For healthcare analysts, consultants, and policymakers, this type of visibility makes it possible to quantify spending trends that previously required large internal claims datasets.
Key Findings from the Dataset
Analysis of the Medicaid Claims by Provider dataset reveals several clear patterns:
- Personal care services dominate Medicaid outpatient spending. HCPCS code T1019 represents one of the largest spending categories across the dataset.
- Large cross-state reimbursement differences exist. Massachusetts providers receive roughly $99 per T1019 claim, while New York providers are reimbursed between $152 and $210 for the same service.
- Consumer-directed personal care programs are expanding rapidly. Freedom Care LLC increased monthly T1019 billing from $5.7 million in January 2018 to $82.9 million by July 2024, a 14.5x increase.
- Certain Medicaid services command very high per-claim payments. Developmental disability case management services billed under HCPCS code T2016 exceed $17,500 per claim in Massachusetts.
Together, these patterns illustrate how state policy decisions, program design, and provider participation can significantly influence Medicaid spending dynamics.
What This Means for Healthcare Market Intelligence
The dataset enables a new level of transparency into Medicaid reimbursement and utilization patterns. Several groups can use these insights to better understand healthcare markets.
Payers and Health Plans
Medicaid reimbursement levels often serve as reference points in broader provider contracting discussions.
The dataset highlights large differences in reimbursement for identical services across states. For example, HCPCS T1019 personal care services average roughly $99 per claim in Massachusetts, while New York providers typically receive between $152 and $210 per claim.
These comparisons provide useful benchmarks for rate modeling, network adequacy analysis, and regional market assessments.
Self-Funded Employers
Employers increasingly monitor Medicaid trends because they influence regional healthcare labor markets and provider supply.
The 14.5x growth in Freedom Care’s monthly billing between 2018 and 2024 demonstrates how rapidly costs can scale when consumer-directed care programs expand.
Understanding these dynamics helps employers anticipate regional healthcare cost pressures and workforce trends tied to Medicaid-funded services.
State Medicaid Agencies and Healthcare Consultants
Provider-level claims data allows policymakers and advisors to benchmark reimbursement and utilization patterns directly.
A state Medicaid program evaluating its personal care spending can compare:
- T1019 reimbursement rates
- beneficiary counts
- claims volume
- claims per beneficiary
against programs in states such as Massachusetts and New York.
This enables agencies and consultants to identify outlier providers, utilization growth patterns, and program cost drivers.
Medtech and Healthcare Technology Companies
Provider-level Medicaid claims data also reveals the economic scale of specific service categories.
For example, developmental disability case management services billed under HCPCS code T2016 in Massachusetts reach roughly $17,575 per claim, generating more than $200 million annually for a single state agency.
For healthcare technology companies focused on care coordination, case management software, or outcomes tracking, datasets like this help quantify the addressable market tied to specific Medicaid service categories.
Data Sources and Methodology
This analysis uses Medicaid claims data released by the U.S. Department of Health and Human Services (HHS) in February 2026.
The raw dataset contains aggregated provider-level claims records for outpatient and professional services billed with valid HCPCS codes between January 2018 and December 2024.
To make the dataset more usable for analysis, the claims data was enriched with provider information from the National Plan and Provider Enumeration System (NPPES), including:
- provider organization names
- service locations
- taxonomy classifications
- provider entity types
Additional derived metrics were calculated to support analysis, including:
- paid per claim
- claims per beneficiary
- total monthly payments
- paid per beneficiary
This enrichment makes it possible to analyze Medicaid spending patterns at the provider, procedure, and geographic level.
Explore the Dataset on Gigasheet
The Medicaid Claims by Provider (2018–2024) dataset used in this analysis is publicly available on Gigasheet.
View the dataset in Gigasheet: Medicaid Claims by Provider, 2018–2024
The dataset can be filtered by:
- HCPCS code
- provider name
- state
- taxonomy classification
- month of service
- payment amounts
Users can explore the data directly in a browser. No downloads required.
Frequently Asked Questions
What is the HHS DOGE Medicaid dataset?
The HHS DOGE Medicaid dataset is the largest provider-level Medicaid claims dataset released by the U.S. Department of Health and Human Services (HHS).
Released in February 2026, the dataset contains aggregated claims records for outpatient and professional services billed with valid HCPCS codes between January 2018 and December 2024.
Key characteristics of the dataset:
- 227 million rows of claims records
- 508,399 unique billing providers
- Coverage across all 50 states and U.S. territories
- Monthly provider-level data including claim counts, unique beneficiaries, and total payments
This dataset allows analysts to examine Medicaid spending trends by provider, procedure code, and state over time.
What is HCPCS code T1019?
HCPCS code T1019 represents non-skilled personal care services provided in a home or community setting.
It is commonly used in Medicaid programs to reimburse personal care aides and home attendants who assist beneficiaries with activities of daily living.
Examples of services billed under T1019 include:
- bathing and personal hygiene
- dressing
- meal preparation
- mobility assistance
- basic household support
Across the 2018–2024 CMS Medicaid dataset, T1019 represents one of the largest spending categories for outpatient Medicaid services.
How much does Medicaid pay for personal care services (T1019)?
Medicaid reimbursement for HCPCS code T1019 varies widely between states.
Based on July 2024 claims data:
These differences reflect state Medicaid fee schedules and program structures, not differences in the underlying service.
What is New York’s Consumer Directed Personal Assistance Program (CDPAP)?
The Consumer Directed Personal Assistance Program (CDPAP) is a New York Medicaid program that allows beneficiaries to hire and supervise their own personal care aides, including family members.
Key features of CDPAP:
- Services are typically billed under HCPCS code T1019
- Claims are processed through fiscal intermediary organizations
- Beneficiaries control caregiver selection and scheduling
The program has grown rapidly. For example:
- Freedom Care LLC increased monthly billing from $5.7 million in January 2018 to $82.9 million in July 2024
- Beneficiaries served grew from 2,140 to 28,053
- This represents 14.5× growth in monthly billing
Which Medicaid provider has the highest monthly billing in the dataset?
Tempus Unlimited, Inc. (NPI 1376609297) consistently appears as the highest-billing provider in the dataset.
Tempus Unlimited administers Massachusetts’ Personal Care Attendant (PCA) program.
In July 2024, the organization reported:
- $118.9 million in total monthly payments
- 39,765 unique beneficiaries
- 1,205,701 claims
- $98.60 per claim
This reflects the large scale of home-based personal care services within Medicaid programs.
How do Medicaid personal care reimbursement rates differ between states?
Reimbursement rates for the same Medicaid service can vary significantly across states.
For HCPCS code T1019 (personal care services) in July 2024:
- Massachusetts: about $98.60 per claim
- New York: approximately $152–$210 per claim
This represents a 54% to 113% higher reimbursement level in New York.
The difference is driven by state Medicaid policy and fee schedules, not differences in the services delivered.
What is the highest per-claim Medicaid reimbursement rate in the dataset?
One of the highest sustained per-claim payments appears in billing by the Massachusetts Department of Developmental Services (NPI 1750504064).
The agency bills HCPCS code T2016, which covers individualized service planning and case management for individuals with developmental disabilities.
Observed payment range:
- $12,398 to $17,575 per claim
Across the full 227 million record dataset, only 10,086 rows exceed $10,000 per claim.
How did COVID-19 affect Medicaid claims volume?
The dataset captures a major decline in healthcare utilization during the early months of the COVID-19 pandemic.
Comparison of provider-procedure-month records:
- January 2019: 2.46 million records
- April 2020: 1.33 million records
This represents a 46% decline in billing activity.
Trends observed during the pandemic:
- Clinic-based outpatient services declined sharply
- Home-based personal care services remained stable
By January 2022, billing volume recovered to 2.94 million records, exceeding pre-pandemic levels.
Where can the enriched Medicaid claims dataset be accessed?
The dataset used in this analysis is publicly accessible through Gigasheet.
The dataset contains 227 million provider-level records covering 2018–2024 and includes enrichment from NPPES, such as:
- provider organization names
- addresses
- taxonomy classifications
- entity types
Users can explore the dataset directly at app.gigasheet.com.
Filtering options include:
- HCPCS code
- provider name
- state
- taxonomy classification
- payment amounts
No downloads are required to explore the dataset.
How does Gigasheet analyze healthcare price transparency data?
Gigasheet is a healthcare market intelligence platform that processes large public healthcare datasets.
The platform analyzes data from sources including:
- Transparency in Coverage (TiC) files
- Hospital price transparency datasets
- CMS claims data
- Sales intelligence data
- Proprietary and customer specific data
Gigasheet provides a familiar interface that allows analysts to explore billions of data points, provider-level pricing and utilization data without building custom data infrastructure.
Capabilities include:
- Filtering by CPT or HCPCS code
- Analyzing pricing by payer, provider, and geography
- Benchmarking reimbursement rates
- Detecting anomalies in provider billing patterns
Raw CMS data is enriched with NPPES provider details, allowing searches by organization name, location, and specialty instead of only NPI numbers.
The intelligence layer for price transparency.

Similar posts


